Constructing a Data TableWhen constructing a data table there are no absolute rules, but there are commonly agreed upon organization patterns. One such example is that the independent variable is recorded in the left column and the dependent variable is recorded in the right column. Data is usually ordered from smallest to largest or largest to smallest. This helps us see a pattern between the changing independent variables and the dependent variables.
Most experiments should be repeated by testing each level of the independent variable several times. Repeated trials reduce the effects of chance errors that sometimes occur in a single trial. |
Transferring Data from a Table to a Graph
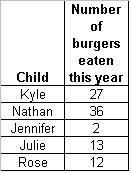
This is an easy two-step process in which you:
1. Observe the data in the data table and write number pairs
2. Use the number pairs to locate the data points on a graph
Graphs show trends and patterns more effectively than just a table because they are more visual.
When writing data pairs, the value for the horizontal x-axis is written first, followed by the vertical y- axis.
(independent variable, dependent variable)
More about constructing data tables: How to Make a Data Table-eHow
